
The Dashboard button, found in the Analytics section, allows you to visualize data for all types of analytics.
.png?cb=b6479c2d469bf5bab44edbf57b0fb915)
Selecting the Dashboard button opens the following page with details:
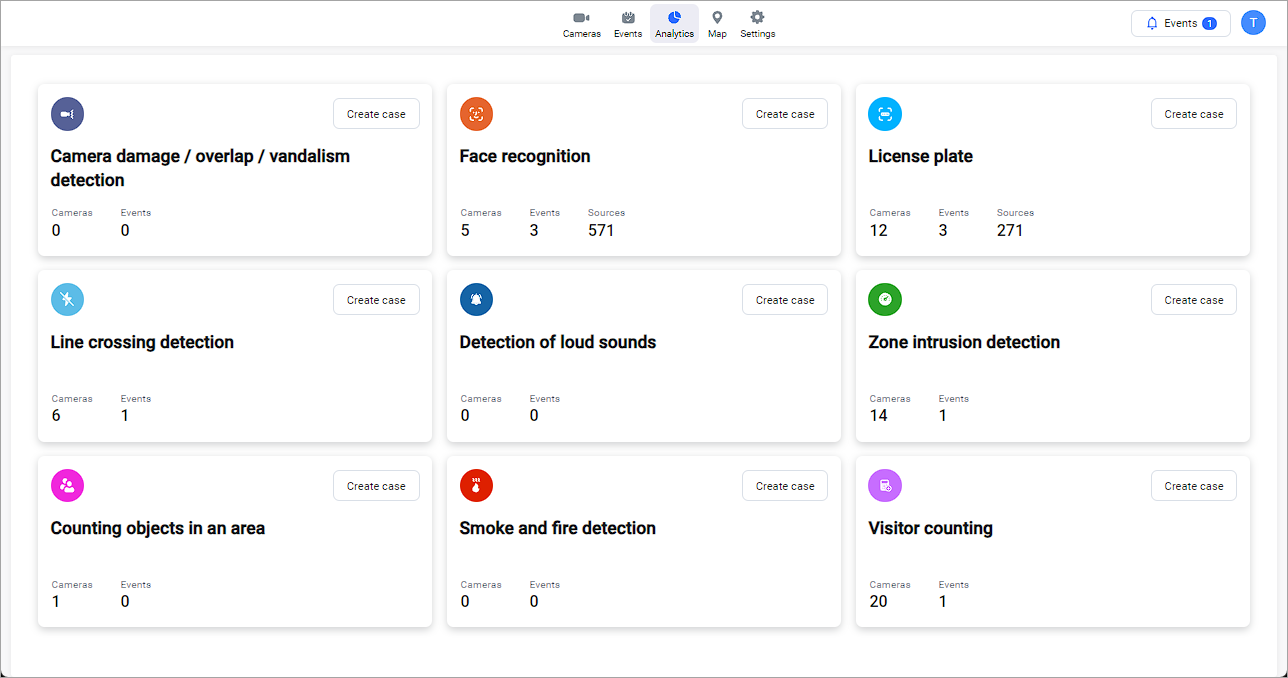
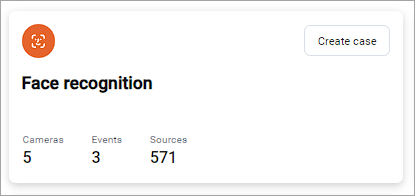
For each type of analytics, the following data is displayed:
-
A unique icon represents each type of analytics.
-
The analytics type name.
-
The Create case button to initiate creating an analytic case.
-
The total number of cameras involved in all cases with this type of analytic. Selecting a number navigates you to the Cameras tab. On the tab, you find a list of cameras that can be filtered by analytics type.
-
The total number of events created in all cases with this type of analytics. Selecting a number navigates you to the Events and reactions tab. On the tab, you find a list of reactions that can be filtered by analytics type.
-
The total number of unique resources involved in cases with this type of analytics. Selecting a number navigates you to the Analytics resources tab. On this tab, you find a list of resources that can filtered by resource type (Faces and License plates) depending on the type of analytics.